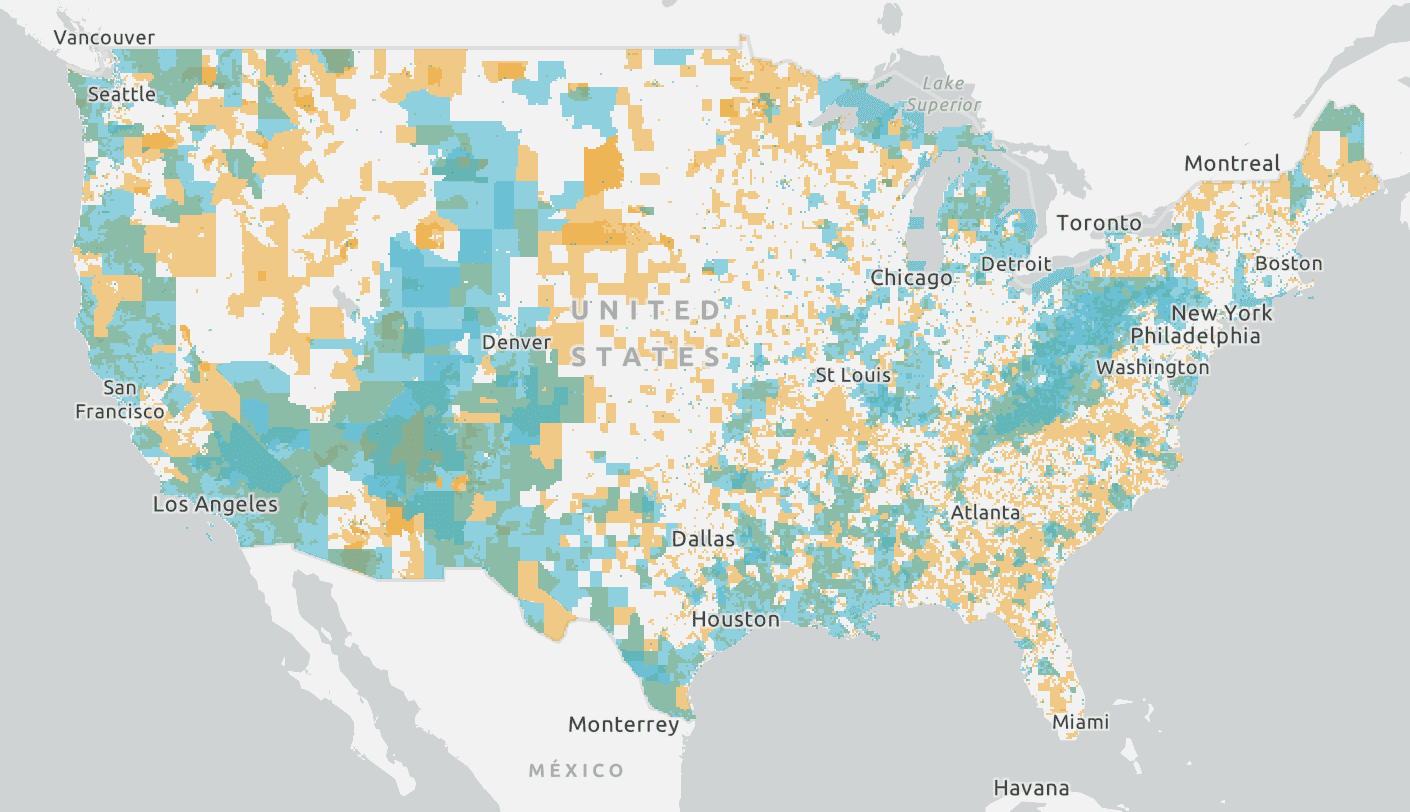
Inflation Reduction Act Map
Focus your outreach for storage retrofits to existing solar projects with ITC opportunities
Stem has developed an Inflation Reduction Act (IRA) Map that displays locations of energy communities throughout the US that are prime for adding energy storage to existing solar sites. This data is extremely helpful for solar developers, asset owners, and EPCs who need to determine where to focus outreach retrofit efforts when capitalizing on the IRA. Use this Map to make sense of where and how to earn the maximum amount of Investment Tax Credits (ITC) available.
Note: Stem is actively tracking Treasury and Department of Energy guidance and will update our Map accordingly.
Stem will work with you by running your portfolio through this interactive map tool and provide a list of your top sites that qualify for the most amount of credits. To get started, complete the form to gain access to the map and a Stem representative will contact you soon to schedule a meeting.
Earn the maximum amount of ITC
As part of the IRA, project developers can receive up to 70% of the project’s cost through ITCs. To reach the full 70%, incentives need to be stacked. A Stem representative can work with you to determine how to gain the most amount of incentives.
Find retrofit projects easily
Within many energy communities, there is a great opportunity for existing sites that don’t already have storage to add standalone storage through a retrofit project. In the past, ITCs only covered storage if it was paired with solar. But there were many solar projects without any storage. By looking at this map, you can determine areas with solar projects that are a good match for a standalone retrofit project so you can earn an additional 10% in credits.
To make the best use of Stem’s Inflation Reduction Act map, you can see the areas that qualify for standalone storage or storage retrofit by isolating the areas within Energy Communities, or find stacked incentives for new solar+storage development in Energy Communities that overlap with Low Income Communities.
Access Map

Yellow areas represent Low Income Communities and Tribal Lands
While all states qualify for solar plus storage credits, there are major regions with opportunity for double bundling, including the Southwest, the Gulf Coast of Texas and Louisiana, and Northeast Appalachian.
Federal government data sources
The different layers of data that comprise Stem’s IRA map are derived from several different federal government agencies, such as the Energy Information Administration, the Department of the Interior, and the Interagency Working Group on Coal and Power Plant, Communities, and Economic Revitalization. Links to their respective reports are in the map.
Complete the form today and a Stem representative will connect with you to discuss how these areas interact with ISOs, utility programs, and state-level incentives for both FTM and BTM.
Disclaimer: This content is preliminary and is provided for informational and planning purposes only regarding the Inflation Reduction Act. This does not constitute legal, tax, regulatory, policy, or other advice or guidance. The provisions in legislative bill text require further clarification and guidance by executive branch, regulatory, and other agencies.